前にAtCoderのレーティングの分布について調べて記事を書きました
sucrose.hatenablog.com
Twitterで「AtCoderにたくさん参加すればレーティングが上がる」という話を見かけて気になったので、ユーザーの参加回数とレーティングの関係を雑にグラフにしたりレーティングの分布のグラフを書いたりしてみました
調べるのが簡単なAtCoderのランキングに書いてある現在のレーティングと参加回数の表のデータを使いました
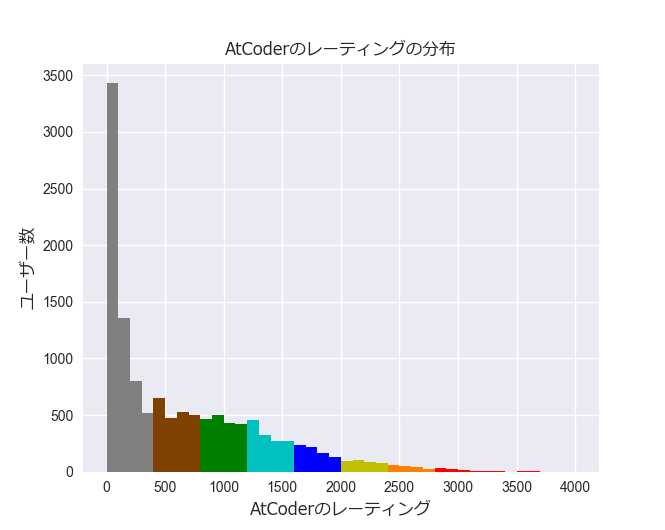
AtCoderのレーティングの分布
レーティングの色分けについてはこちら↓
1回しか参加していないユーザーも数えているので灰色が全体の半分近くを占めています

| レーティング | レーティング上位何%か |
|---|---|
| 2800(赤) | 1% |
| 2400(オレンジ) | 2% |
| 2000(黄色) | 5% |
| 1600(青) | 11% |
| 1200(水色) | 21% |
| 800(緑) | 35% |
| 400(茶色) | 52% |
| 0(灰色) | 100% |
参加回数とレーティングの関係
見たところ10回から15回ぐらいの参加まではレーティングの平均が大きく変わっていそう
その後の参加回数が増えるごとにレーティングの平均は徐々に増えていっているように見えますが回数が増えてもばらつきは結構大きいです

感想
参加回数が多いほどレーティングの平均が増えていそうな気もする
やる気の有無が参加回数とレーティングの上昇の両方に関わってくると思われるので、もっとちゃんと調べるなら個々のユーザーのレーティングの上下を追ってちゃんと調べないとダメそう
おまけ: 箱ひげ図
箱ひげ図も書いたのでついでに貼っておきます
上の平均と標準偏差の棒グラフと見比べると結構印象が変わります

ソースコード
# coding: utf-8
import pyquery
import requests
import time
import scipy.stats
import numpy as np
import pandas as pd
import seaborn as sns
import matplotlib.font_manager
import matplotlib.cm as cm
import tqdm
import matplotlib.pyplot as plt

rating_atcoder = []
counts = []
for i in tqdm.tqdm(xrange(1, 129)):
    table = pyquery.PyQuery(url='https://atcoder.jp/ranking?p={}'.format(i))
    for elm in table.find('tr')[1:]:
        tr = pyquery.PyQuery(elm)
        tds = tr.find('td')
        rank = int(pyquery.PyQuery(tds[0]).text())
        name = pyquery.PyQuery(tds[1]).text()
        rating = int(pyquery.PyQuery(tds[2]).text())
        count = int(pyquery.PyQuery(tds[4]).text())

        rating_atcoder.append(rating)
        counts.append(count)
    time.sleep(1)

df = pd.DataFrame({
    'rating_atcoder': rating_atcoder,
    'count': counts
})

prop = matplotlib.font_manager.FontProperties(fname=r'C:\Windows\Fonts\meiryo.ttc', size=12)

plt.hist(df[df['rating_atcoder'] < 400].reset_index()['rating_atcoder'], bins=range(0, 4001, 100), histtype='stepfilled', color='#808080')
plt.hist(df[(400 <= df['rating_atcoder']) & (df['rating_atcoder'] < 800)].reset_index()['rating_atcoder'], bins=range(0, 4001, 100), histtype='stepfilled', color='#804000')
plt.hist(df[(800 <= df['rating_atcoder']) & (df['rating_atcoder'] < 1200)].reset_index()['rating_atcoder'], bins=range(0, 4001, 100), histtype='stepfilled', color='#008000')
plt.hist(df[(1200 <= df['rating_atcoder']) & (df['rating_atcoder'] < 1600)].reset_index()['rating_atcoder'], bins=range(0, 4001, 100), histtype='stepfilled', color='#00C0C0')
plt.hist(df[(1600 <= df['rating_atcoder']) & (df['rating_atcoder'] < 2000)].reset_index()['rating_atcoder'], bins=range(0, 4001, 100), histtype='stepfilled', color='#0000FF')
plt.hist(df[(2000 <= df['rating_atcoder']) & (df['rating_atcoder'] < 2400)].reset_index()['rating_atcoder'], bins=range(0, 4001, 100), histtype='stepfilled', color='#C0C000')
plt.hist(df[(2400 <= df['rating_atcoder']) & (df['rating_atcoder'] < 2800)].reset_index()['rating_atcoder'], bins=range(0, 4001, 100), histtype='stepfilled', color='#FF8000')
plt.hist(df[2800 <= df['rating_atcoder']].reset_index()['rating_atcoder'], bins=range(0, 4001, 100), histtype='stepfilled', color='#FF0000')
plt.title(u'AtCoderのレーティングの分布', fontproperties=prop)
plt.xlabel(u'AtCoderのレーティング', fontproperties=prop)
plt.ylabel(u'ユーザー数', fontproperties=prop)
plt.show()

print 'rating: percentile'
for i in [0, 400, 800, 1200, 1600, 2000, 2400, 2800]:
    print '{}: {:.3}'.format(i, 100 - scipy.stats.percentileofscore(df['rating_atcoder'], i))

df = df.dropna()

# 回数ごとの分布も出す

sns.barplot(x=df['count'], y=df['rating_atcoder'], ci='sd')
plt.title(u'AtCoderの参加回数ごとのレーティングの平均と標準偏差', fontproperties=prop)
plt.xlabel(u'AtCoderの参加回数', fontproperties=prop)
plt.ylabel(u'レーティングの平均', fontproperties=prop)
plt.show()

# 箱ひげ図
sns.boxplot(x=df['count'], y=df['rating_atcoder'])
plt.title(u'AtCoderの参加回数ごとのレーティング(箱ひげ図)', fontproperties=prop)
plt.xlabel(u'AtCoderの参加回数', fontproperties=prop)
plt.ylabel(u'レーティング', fontproperties=prop)
plt.show()

print df.groupby('count').mean()['rating_atcoder']