TwitterにはTwitterアナリティクスというアクセス解析があります
インプレッション(見られた数)やふぁぼられた数、リツイートされた数、その他多くの情報がわかります
最近のデータをCSVでダウンロードできるようになっています(あまり長期のデータはダウンロードできない)
このデータを使って何時頃に投稿するとインプレッションが多いのか調べてみます
プロットしていろいろと見てみる
とりあえずプロットしてみます
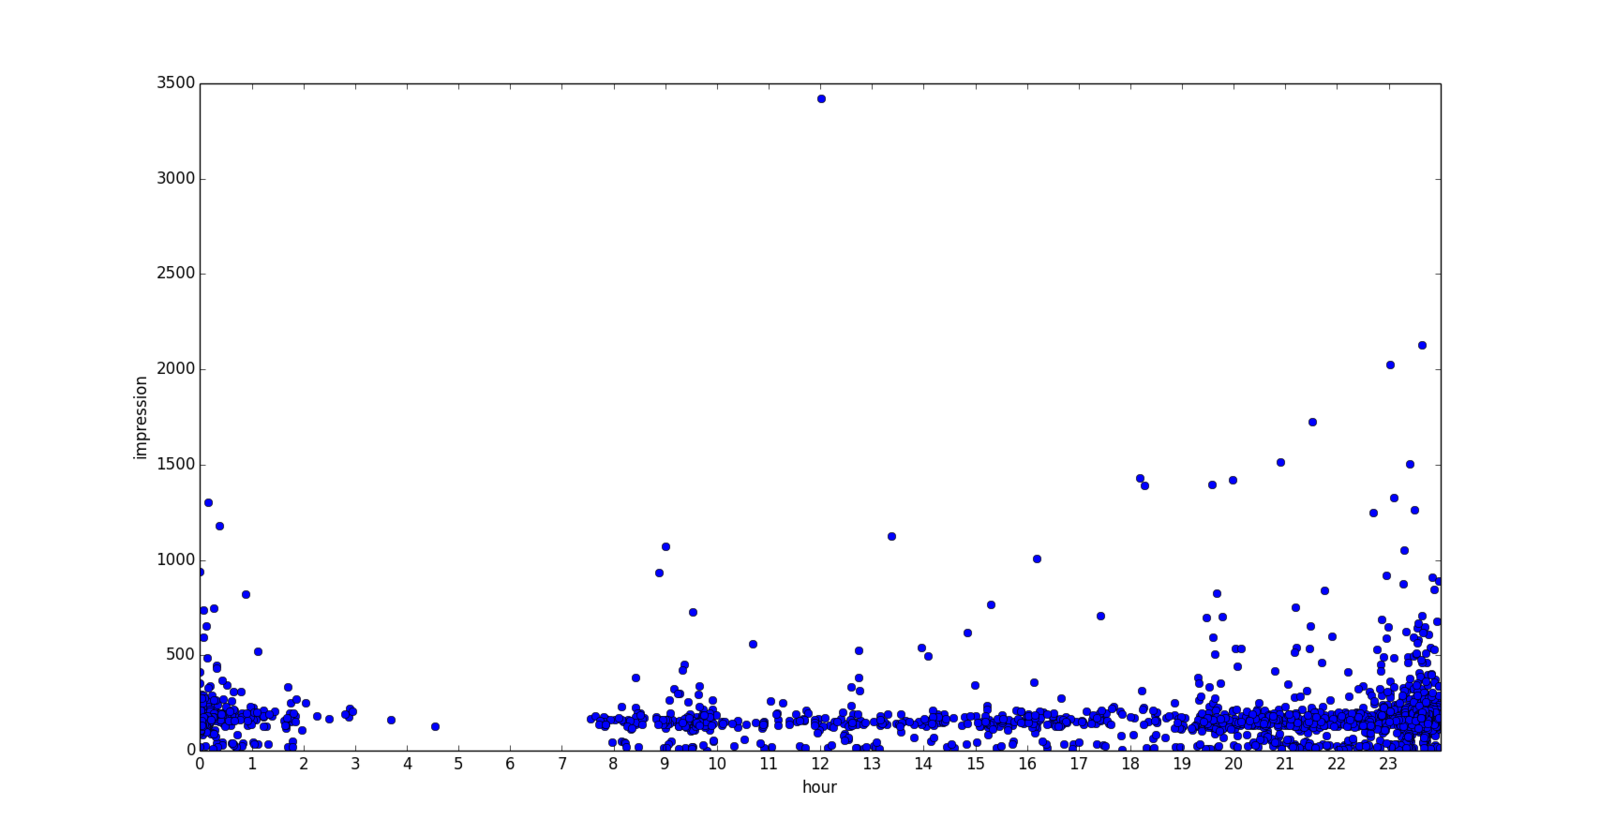
一目外れ値が多そうですし、怪しい形をしているので、データをフィルタリングしていきます
以下のプロットを見ると、リツイートされているツイートはその他のツイートよりも明らかに上にあるので除外します
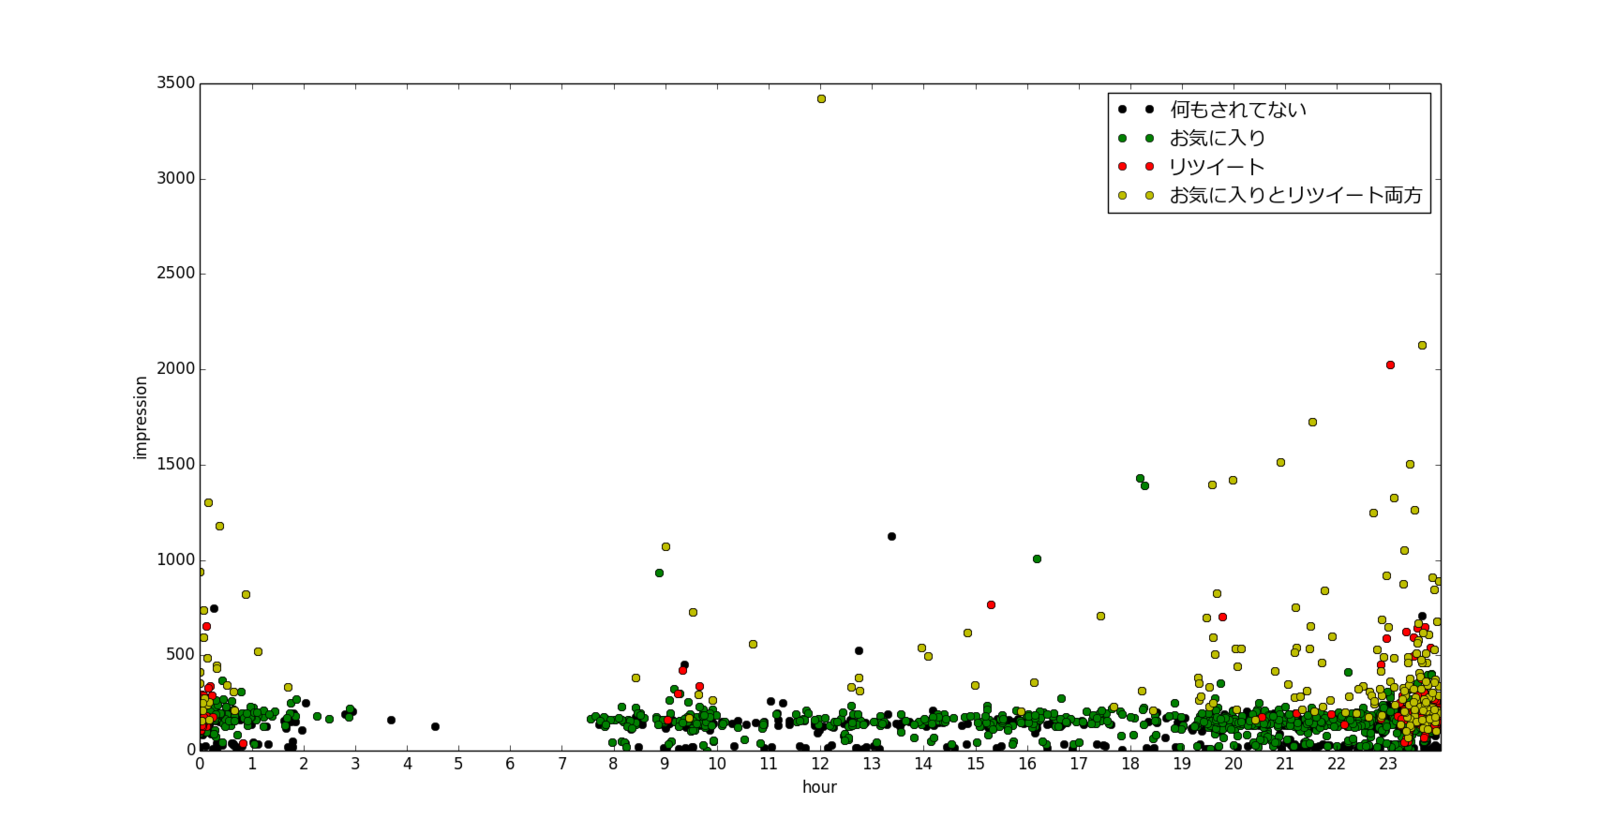
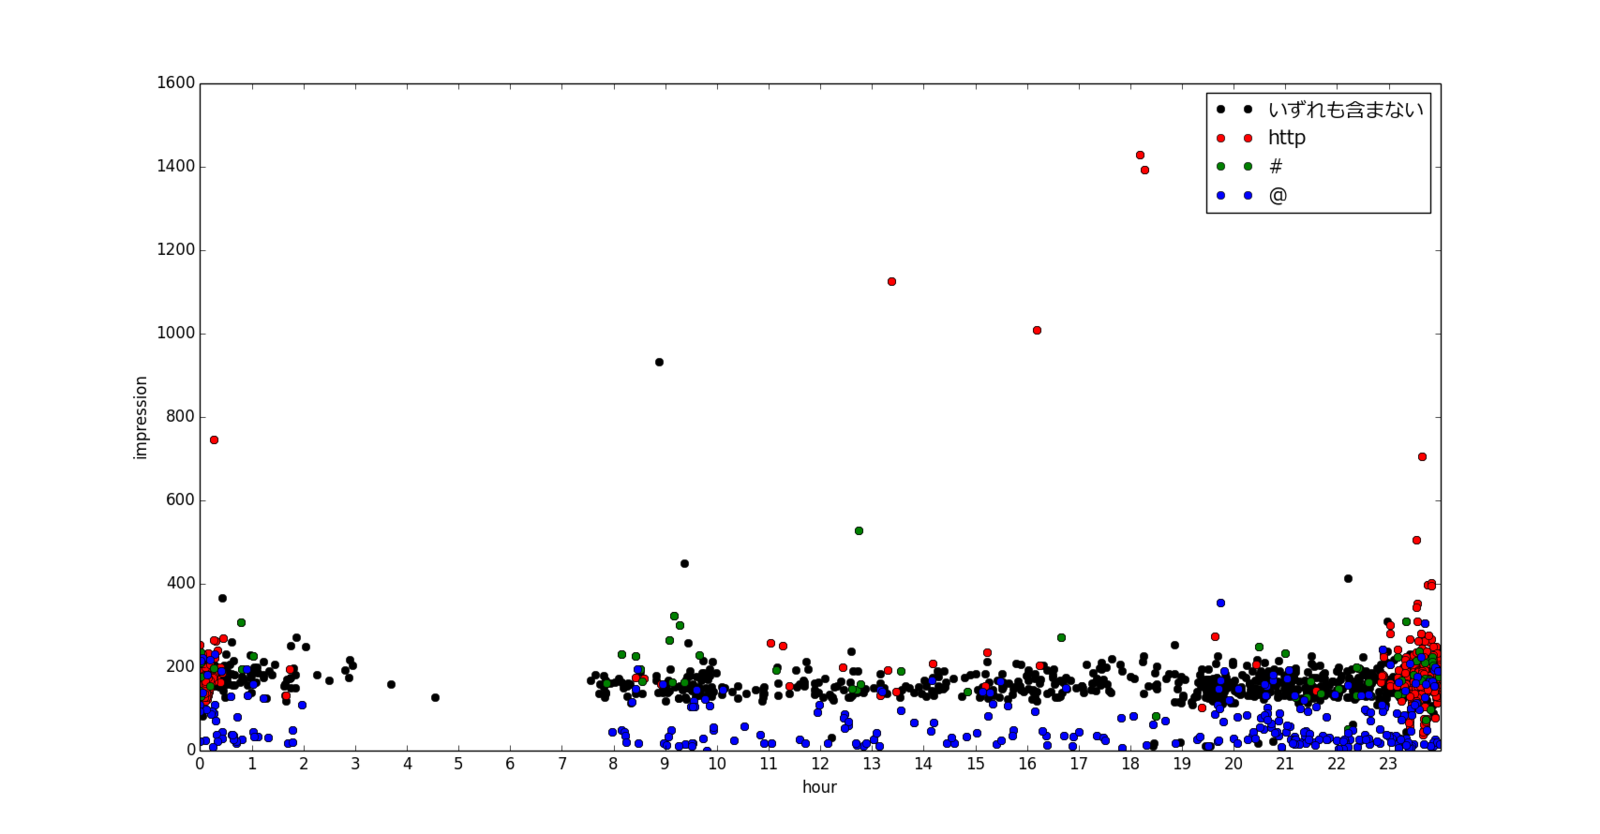
除外後のデータで、更にリンクやハッシュタグ、@メンションを含むかどうかでプロットします
@メンションは明らかに下側に離れたところに分布しています
これら3つも除外します
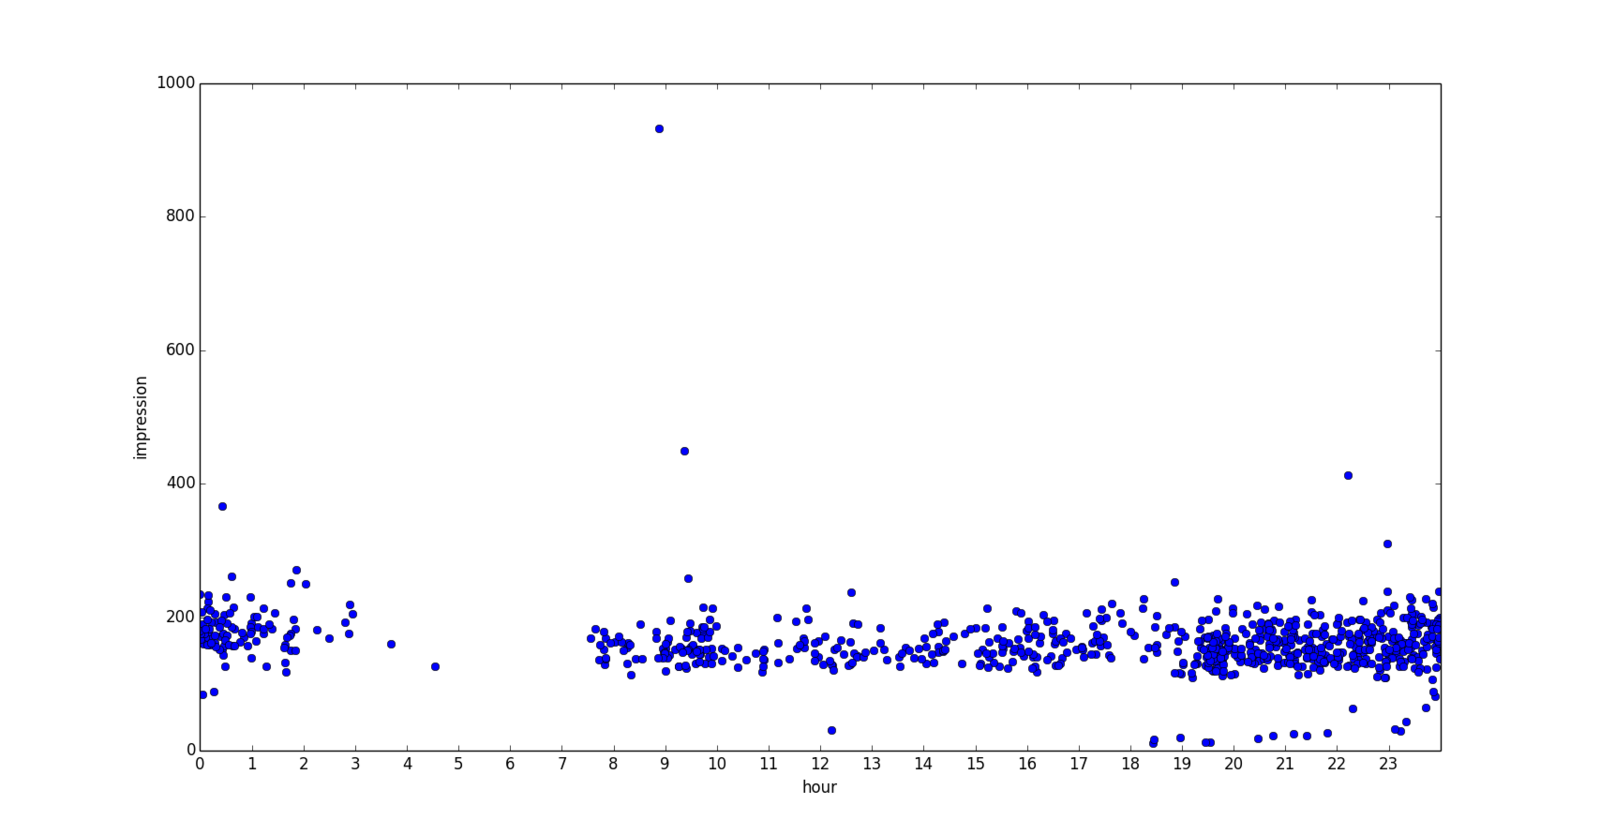
すると次のようなそこそこきれいな散布図が得られました
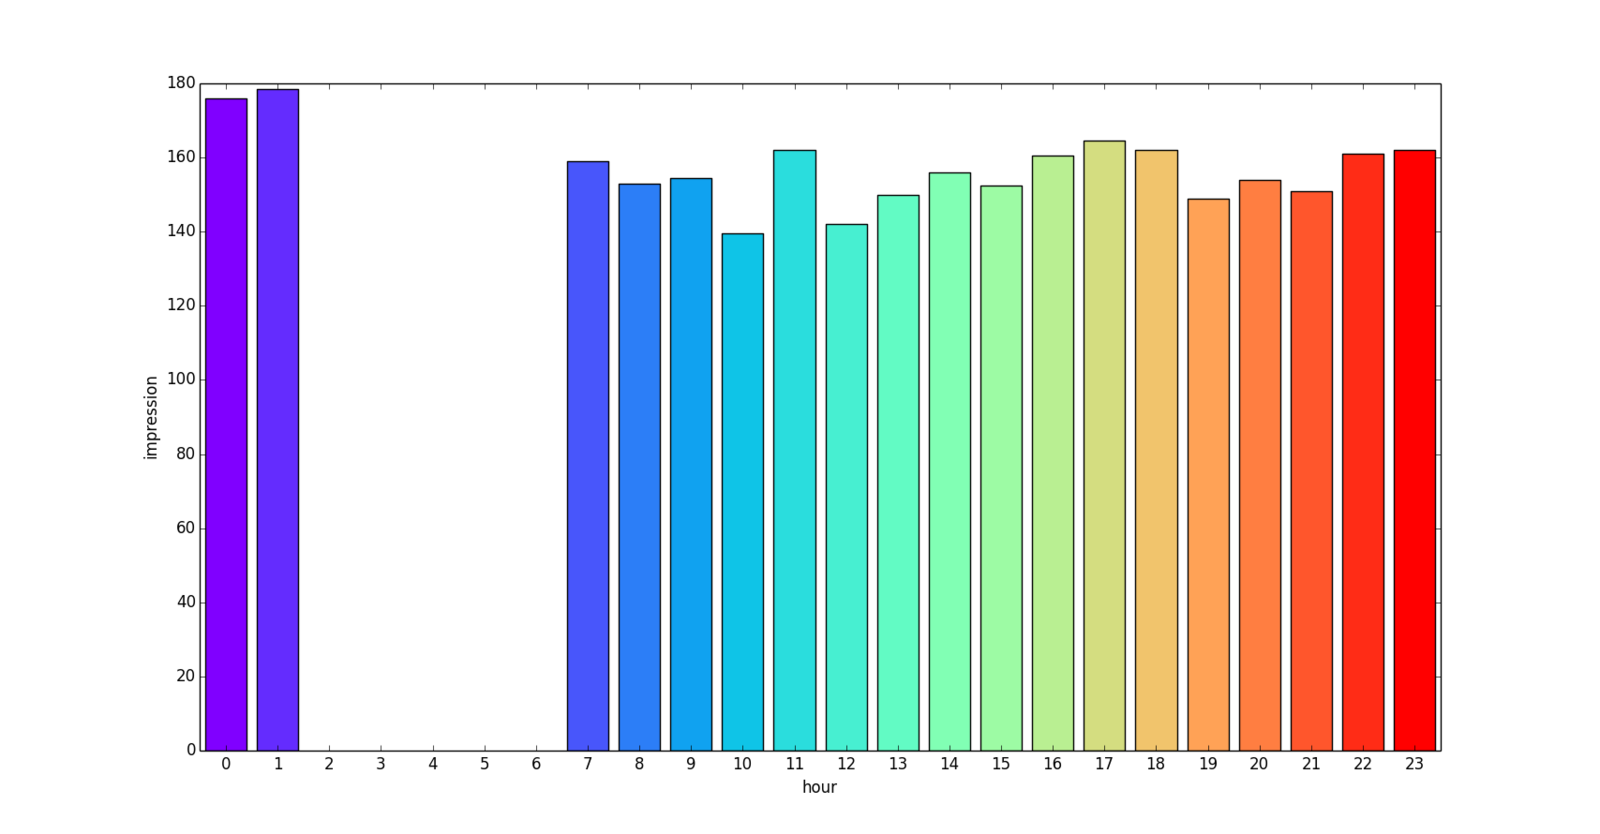
時刻ごとのインプレッションの推定
フィルタリング後も外れ値っぽいのが少し残っているので、時刻ごとのインプレッションの中央値を出しました
データ点が10以上ある時刻だけを示しています
夜中の0時、1時辺りが一番インプレッションが多いみたいです
理由は、夜型の人が多いのか、他の人の投稿が減る分見られやすくなるのか、なんでしょうかね?
あとは10時、12時、19時あたりがちょっと見られづらいということがわかりました
11時が高い理由が謎ですが……
追記。Twitterで「11時は昼休み前だから見られやすいのではないか?」という意見をいただきました。確かにありえそうな話ですね
まとめ
Twitterアナリティクスのデータを使ってフォロワーに読まれやすい時間帯を求めた(もちろんフォロワーの分布によって結果は異なるので注意
リツイートやメンションなどで、インプレッションの分布は大きく変動するので注意が必要
データを見るときには単純に散布図とかにするだけでもいろいろわかる
ちなみに休日と平日でどう違うかも求めてみようと思ったのですが、休日のデータ点があまり多くなかったのでやめました
ソースコード
Pythonのデータ加工用のライブラリ(?)のpandasを使っているので、pip install pandasなどしてから試してみてください
pandasは結構便利なので覚えていて損はないと思います
他にもmatplotlibなども使用しています
あとフォントを指定しているところがあるので、適切なフォントに書き換えてください
tweet_activity_metrics.csvというのがダウンロードしてきたCSVへのパスです
2015年06月26日版
いつの間にかTwitter側のファイル形式が変わっていたのでコードを修正した
# -*- coding: utf-8 -*-
import pandas as pd
from pylab import *

data = pd.read_csv('tweet_activity_metrics.csv', parse_dates=['時間'], index_col = '時間')
data.index = data.index.tz_localize('UTC').tz_convert('Asia/Tokyo')

plot(data.index.time, data.impressions, 'o')
xlim('00:00:00', '23:59:59')
xticks(map(lambda x: datetime.time(x, 0), range(24)), range(24))
xlabel('hour')
ylabel('impression')
show()


plot(data.index.time, data.impressions, 'ko')
favorited = data[data['お気に入り'] > 0]
plot(favorited.index.time, favorited.impressions, 'go')
retweeted = data[data.retweets > 0]
plot(retweeted.index.time, retweeted.impressions, 'ro')
cap = data[(data['お気に入り'] > 0) & (data.retweets > 0)]
plot(cap.index.time, cap.impressions, 'yo')
xlim('00:00:00', '23:59:59')
xticks(map(lambda x: datetime.time(x, 0), range(24)), range(24))
xlabel('hour')
ylabel('impression')
prop = matplotlib.font_manager.FontProperties(fname=r'C:\Windows\Fonts\meiryo.ttc', size=15)
legend([u'何もされてない', u'お気に入り', u'リツイート', u'お気に入りとリツイート両方'], prop=prop)
show()

no_ret_fav = data[(data.retweets == 0)]
http = no_ret_fav[no_ret_fav['Tweet text'].map(lambda x: 'http' in x)]
hash = no_ret_fav[no_ret_fav['Tweet text'].map(lambda x: '#' in x)]
mention = no_ret_fav[no_ret_fav['Tweet text'].map(lambda x: '@' in x)]
plot(no_ret_fav.index.time, no_ret_fav.impressions, 'ko')
plot(http.index.time, http.impressions, 'ro')
plot(hash.index.time, hash.impressions, 'go')
plot(mention.index.time, mention.impressions, 'bo')
xlim('00:00:00', '23:59:59')
xticks(map(lambda x: datetime.time(x, 0), range(24)), range(24))
xlabel('hour')
ylabel('impression')
prop = matplotlib.font_manager.FontProperties(fname=r'C:\Windows\Fonts\meiryo.ttc', size=15)
legend([u'いずれも含まない', u'http', u'#', u'@'], prop=prop)
show()

filtered = data[(data.retweets == 0) & (data['Tweet text'].map(lambda x: 'http' not in x and '#' not in x and '@' not in x))]
plot(filtered.index.time, filtered.impressions, 'o')
xlim('00:00:00', '23:59:59')
xticks(map(lambda x: datetime.time(x, 0), range(24)), range(24))
xlabel('hour')
ylabel('impression')
show()


median = filtered.groupby(by = lambda x: x.hour).median()['impressions'][filtered.groupby(by = lambda x: x.hour).count()['impressions'] >= 10]
bar(median.index, median, 0.8, align='center', color=cm.rainbow(np.linspace(0, 1, len(median))))
xlim(-0.5, 23.5)
xticks(range(24))
xlabel('hour')
ylabel('impression')
show()
2014年12月6日版
# -*- coding: utf-8 -*-
import pandas as pd
from pylab import *

data = pd.read_csv('tweet_activity_metrics.csv', parse_dates=['time'], index_col = 'time')
data.index = data.index.tz_localize('UTC').tz_convert('Asia/Tokyo')

plot(data.index.time, data.impressions, 'o')
xlim('00:00:00', '23:59:59')
xticks(map(lambda x: datetime.time(x, 0), range(24)), range(24))
xlabel('hour')
ylabel('impression')
show()


plot(data.index.time, data.impressions, 'ko')
favorited = data[data.favorites > 0]
plot(favorited.index.time, favorited.impressions, 'go')
retweeted = data[data.retweets > 0]
plot(retweeted.index.time, retweeted.impressions, 'ro')
cap = data[(data.favorites > 0) & (data.retweets > 0)]
plot(cap.index.time, cap.impressions, 'yo')
xlim('00:00:00', '23:59:59')
xticks(map(lambda x: datetime.time(x, 0), range(24)), range(24))
xlabel('hour')
ylabel('impression')
prop = matplotlib.font_manager.FontProperties(fname=r'C:\Windows\Fonts\meiryo.ttc', size=15)
legend([u'何もされてない', u'お気に入り', u'リツイート', u'お気に入りとリツイート両方'], prop=prop)
show()

no_ret_fav = data[(data.retweets == 0)]
http = no_ret_fav[no_ret_fav['Tweet text'].map(lambda x: 'http' in x)]
hash = no_ret_fav[no_ret_fav['Tweet text'].map(lambda x: '#' in x)]
mention = no_ret_fav[no_ret_fav['Tweet text'].map(lambda x: '@' in x)]
plot(no_ret_fav.index.time, no_ret_fav.impressions, 'ko')
plot(http.index.time, http.impressions, 'ro')
plot(hash.index.time, hash.impressions, 'go')
plot(mention.index.time, mention.impressions, 'bo')
xlim('00:00:00', '23:59:59')
xticks(map(lambda x: datetime.time(x, 0), range(24)), range(24))
xlabel('hour')
ylabel('impression')
prop = matplotlib.font_manager.FontProperties(fname=r'C:\Windows\Fonts\meiryo.ttc', size=15)
legend([u'いずれも含まない', u'http', u'#', u'@'], prop=prop)
show()

filtered = data[(data.retweets == 0) & (data['Tweet text'].map(lambda x: 'http' not in x and '#' not in x and '@' not in x))]
plot(filtered.index.time, filtered.impressions, 'o')
xlim('00:00:00', '23:59:59')
xticks(map(lambda x: datetime.time(x, 0), range(24)), range(24))
xlabel('hour')
ylabel('impression')
show()


median = filtered.groupby(by = lambda x: x.hour).median()['impressions'][filtered.groupby(by = lambda x: x.hour).count()['impressions'] >= 10]
bar(median.index, median, 0.8, align='center', color=cm.rainbow(np.linspace(0, 1, len(median))))
xlim(-0.5, 23.5)
xticks(range(24))
xlabel('hour')
ylabel('impression')
show()